HI-TEC - Multitrack
Multitrack Software for Viewing and Analyzing Graphs.
It is a software for Microsoft (TM) operating systems 32bit based on the Millenium DAS data management libraries (program for advanced analysis developed by HI-TEC for the Acquistion Date applications) and uses some of its plugins (FFT, MultiOP, THD and power meter).
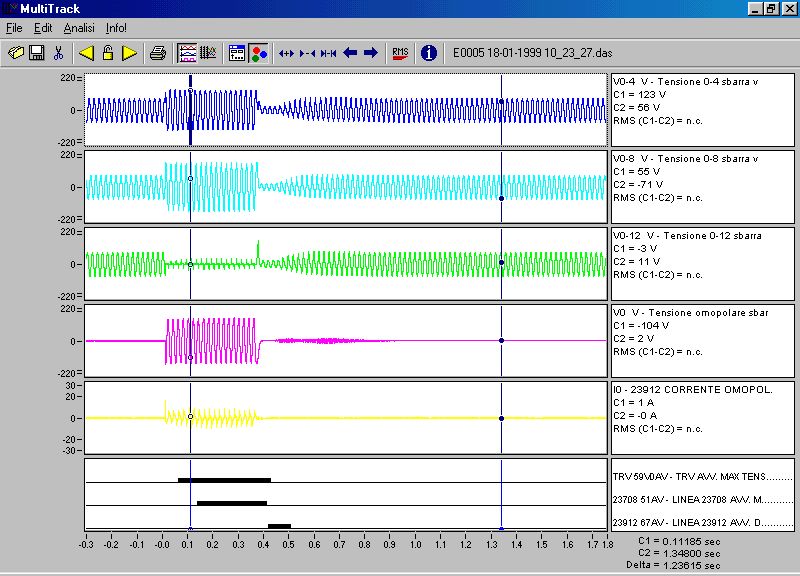
Representation of analog and digital channels using multi-track chart
- Representation of analog and digital channels with graphic multiscale
- Definition of the sun curves that are to be analyzed
- Moving double sliders to the detailed analysis of the recordings
- Horizontal and vertical compression Expansion
- Scrolling to the left or to the right of the recording
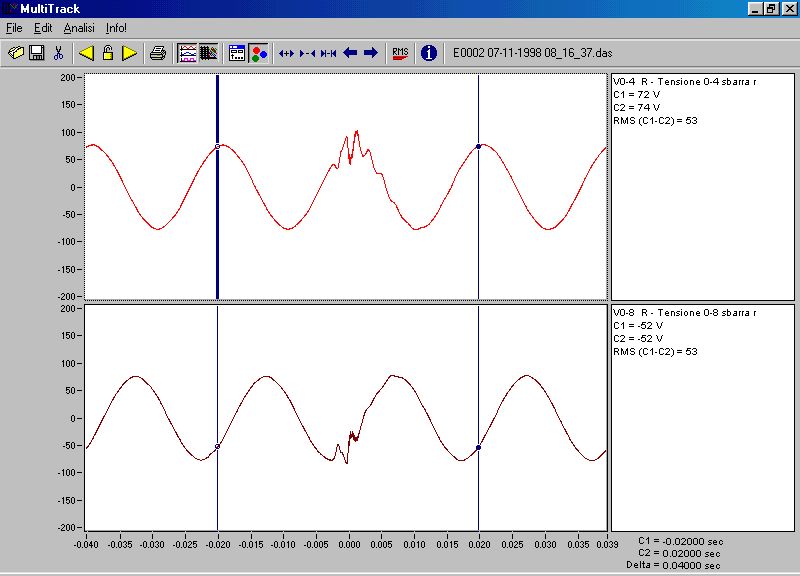
- Of the RMS value calculation
- Operations of algebraic curves and constant
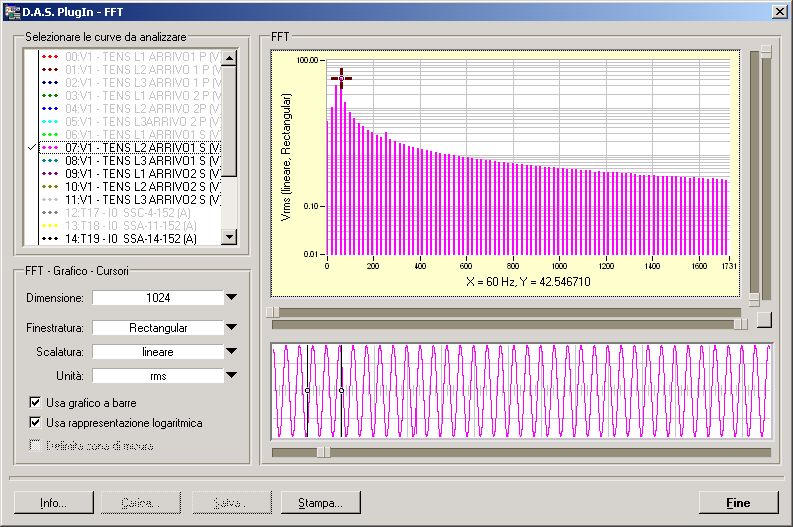
- Calculating the FFT
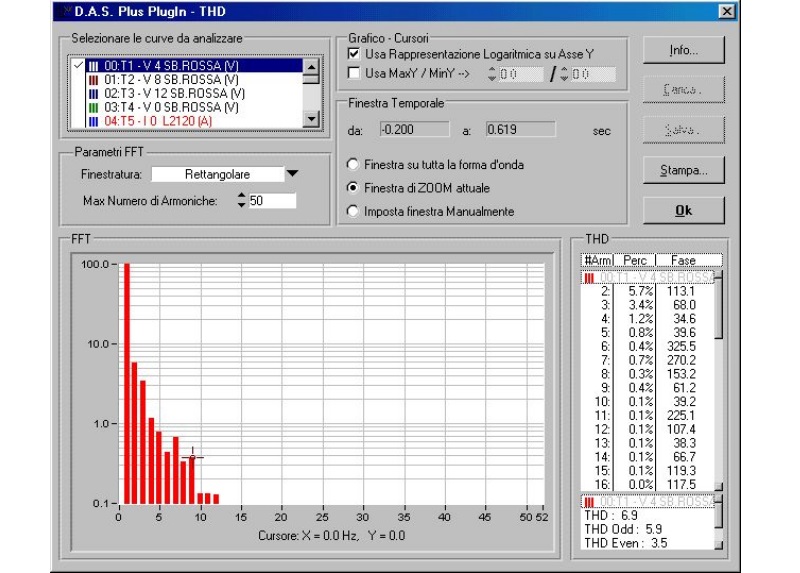
- Calculation of total harmonic distortion (THD)
- Calculation of power and associated parameters
- Data export in TXT format (ASCII)
- Data export in COMTRADE format
- Print graphics
In the Analysis menu are available the following functions:
RMS: allows you to calculate the RMS value in the range between the two cursors
FFT: This plug-in allows you to perform the Fast Fourier Transform interactively on any data (curve) currently loaded
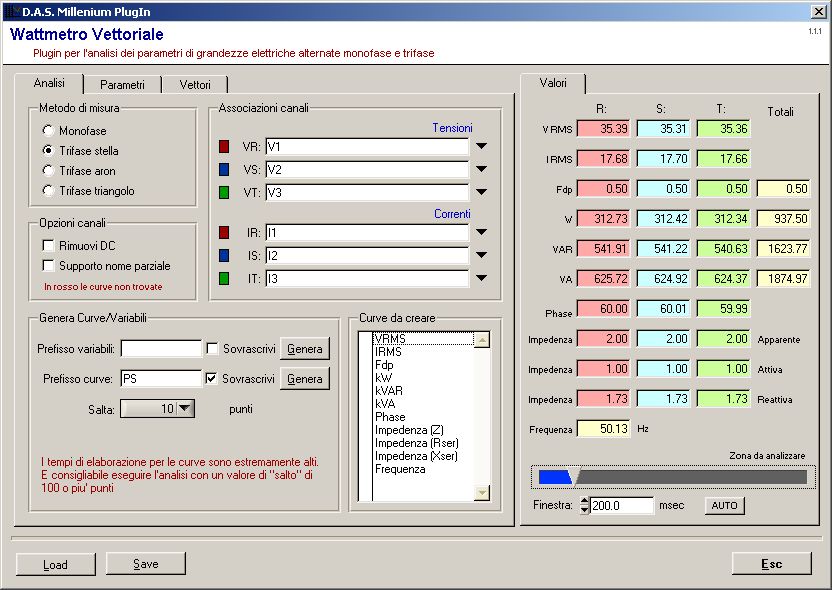
Wattmeter: The plug-in allows you to make a complete analysis of a three-phase system, three voltages and three currents, and monophase to the periodic behavior in time, with a fundamental frequency between 16 and 70 Hz with possible significant harmonic content up to the seventh harmonic.
The software is able to calculate:
- System Frequency
- True effective value of the voltage and current for each phase
- Power Active, Reactive and Apparent for each phase and total
- The power factor for each phase and total
- Phase shift between voltage and current relative
transactions between multiple curves: This plug-in, which is accessed from the Analysis menu, allows you to perform the operations of addition, subtraction, multiplication, division and average basis between two or more homogeneous signals
Importer: With this plug-in, which is accessed from the Analysis menu, you can import other files within the data tracks in memory. When you start the plug-in, it has a window like the one in Figure 3.65. This window can display the curves in the memory and you have the potential for removing one or more.
Time Adapter: With this plug-in, which is accessed from the Analysis menu, you can make consistent and congruent curves from different sources. It’s possible to delete or replace with zero the data that are not common to all the selected curves.
.DAS to .SOE: This plug-in, available from the Analysis menu, you can reconstruct the sequence of digital events (RCE) from an oscilloperturbographic file type of DAS. The user must choose which of the digital channels stored in the memory must be scanned and select the name of the file to be created .RCE. The plug-in provides to analyze chronologically digital tracks selected and builds its own event history file for each encountered digital transition. The file thus generated can be read through the RCEReader whose program is descripted in this manual.
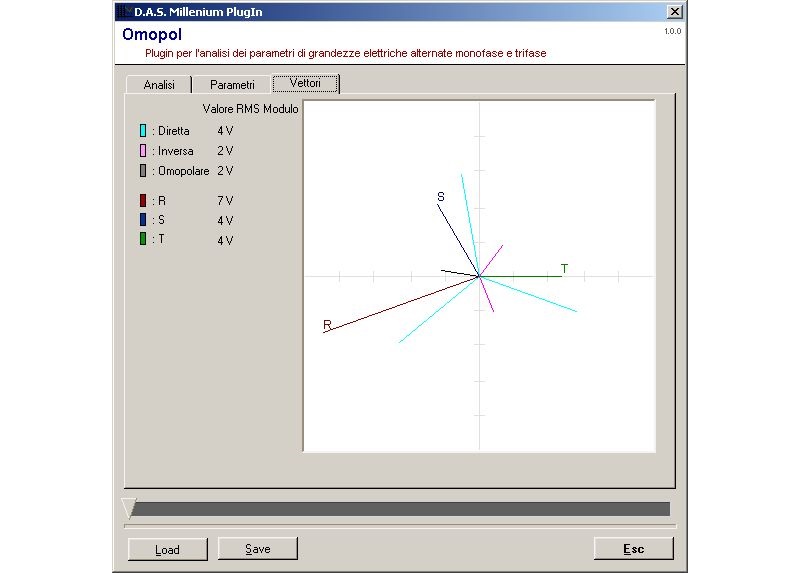
Homopol: With this plug-in, which is accessed from the Analysis menu, you can perform an analysis of the direct and inverse components of a set of three analog signals selected by the user (Fig. 3.69) . The user has the possibility to generate the curves relating to direct sequence, reverse, homopolar, R-frequency, frequency, and S and T frequency with a time base of 20ms. These curves will be part of those present in memory and can be displayed and analyzed in a similar way to those acquired.